
Siebel Analytics Answers and Dashboards (a quick getting started guide based on HR schema)
The last post on Sibel Analytics discussed how we build a physical , Business and presentation layer using Siebel Analytics Administration.
This post will focus on using Answers and Dashboards.
Make sure Siebel Analytics Web is up.
For the purpose of this post , I have demonstrated on how you can build Reports using “Answers” against the “hr” schema.
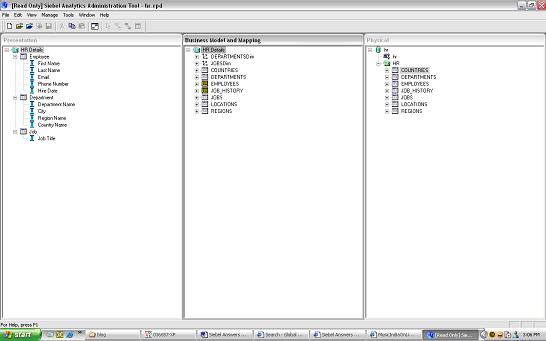
Physical Layer - Make sure to define the object relationships appropriately in the physical layer
COUNTRIES
DEPARTMENTS
EMPLOYEES
JOB_HISTORY
JOBS
LOCATIONS
REGIONS
Busines Layer - Make sure to define the object relationships appropriately in the Business layer
COUNTRIES
DEPARTMENTS
EMPLOYEES
JOB_HISTORY
JOBS
LOCATIONS
REGIONS
Dimensions:
Department Dimension (3 level Dimension)
-Department
-Region
-Country
Job Dimension
-Job Detail
Presentation Layer defined as follows:
Employee
First Name
Last Name
Phone Number
Hire Date
Department
Department Name
City
Region Name
Country Name
Job
Job Title
 Once the Presentation Layer is defined you are ready to move on to Answers to build your Siebel Analytics Reports
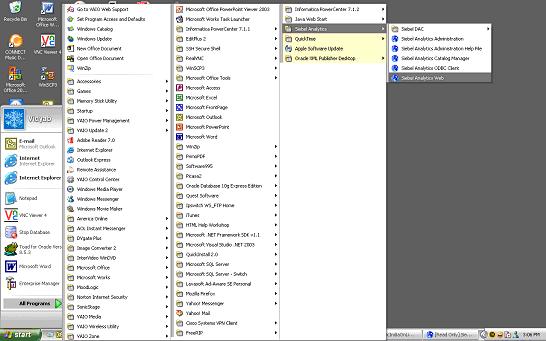 If you have all Siebel Client Tools on your Desktop ; Siebel Analytics web will take you to the Analytics web page
 The default installation
Default username : AdministratorDefault password: no password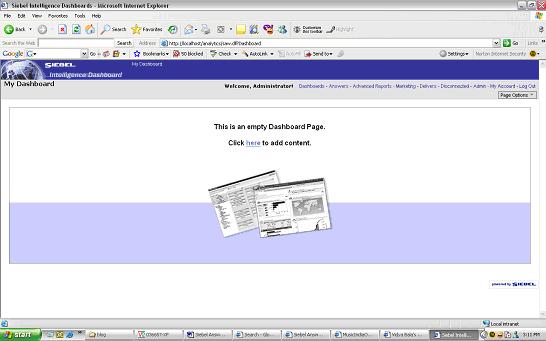 once you have logged in you will see the following Tabs
Dashboards,Answers, Advanced Reports,Marketing,Delivers,Disconnected,Admin,My-Account
Step1:
Before proceeding to answers to create Reports let us first create a Shared Folder named “hr” where we can save our Reports. Click on Answers and on the left hand side you should see My Folder > Shared Folder > Manage Catalog
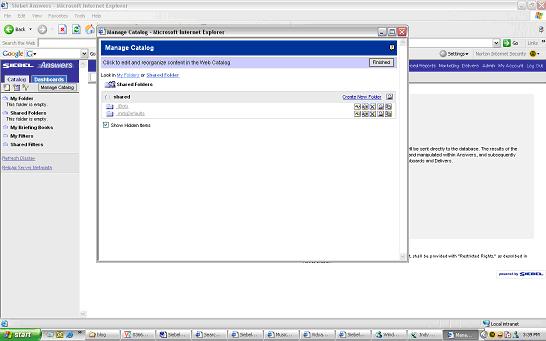 click on Manage catalog > Shared Folder and you should be able to create a new folder
 make sure to Refresh Display to verify that the changes have taken effect
Step2:
Now you are ready to create Reports using Answers
Click on Answers > Answers is basically your web interface to building Reports
on the right handside you should see Subject areas
click on HRDetails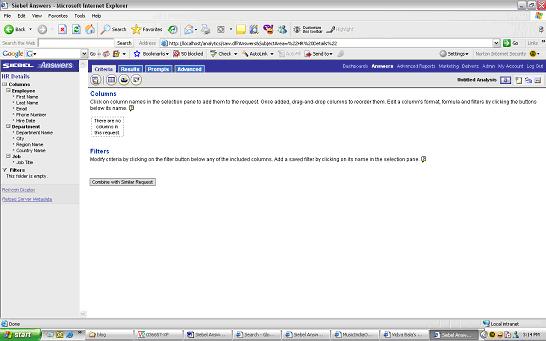 you will now see on the left hand side bar all the Data Items that were defined in the Presentation Layer defined available in Answers
Employee
First Name
Last Name
Email
Phone Number
Hire Date
Department
Department Name
City
Region Name
Country Name
Job
Job Title
Example1 – Report1
To build a Report
First Name,LastName,Department Name,Country Name, Region Name, City
Click on the attributes so that they appear under columns:
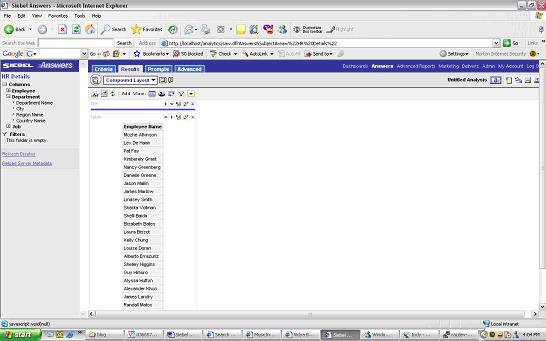
 click on Results and you should see the Results
 save your Report to the “hr” shared folder.
 The above Report was HR Employee Demographic Details (List of employees by name,department,city,county)
Example2 – Report 2
Pie Chart to give an overview of number of employees by DepartmentClick on create new request
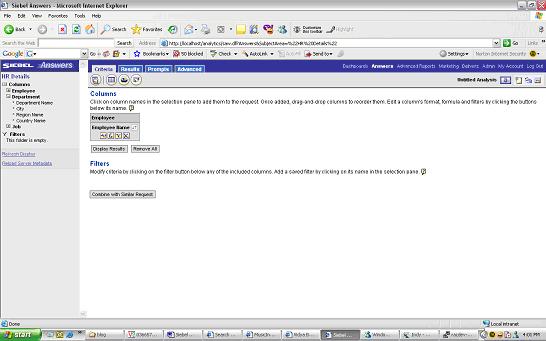 Edit Column formula to display first name and last name as a single column called “Employee Name”
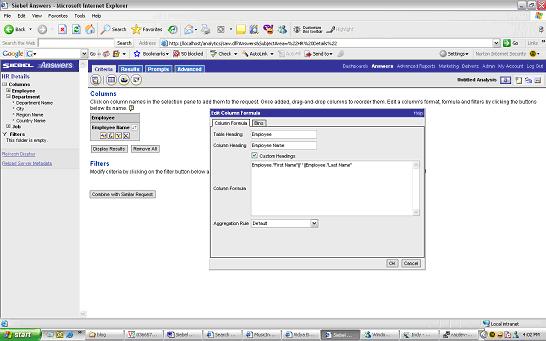
 The next step would be to get a count of employees by DepartmentCriteria Tab add Department name and modify “Employee Name” column formula to “count(Employee."First Name"' ' Employee."Last Name")”
 The Results would be as above. Now to covert this to a pie chart (make sure to start Siebel Analytics Java Host)
 Click on the Pie Chart
 Save the Request as “Employees by Department”
Example 3:We now have 2 Reports
“Employees by Department”
“HR Employee Demographic Details”
lets now add the above 2 Reports to a Dashboard
Click on the Admin Tab
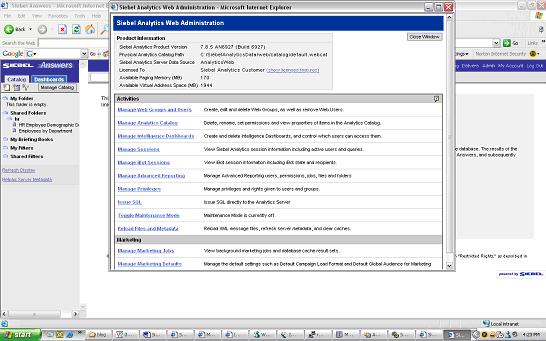 Click on Manage Intelligence Dashboards.
 Create Dashboard. Name the dashboard as “HR Details”
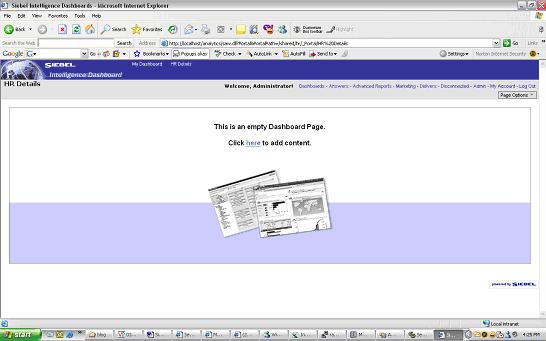 you should see the “HR Details” dashboard appear near the “My Dashboard”
Click to Add content and you should be able to add the 2 Reports we created in the “hr” shared folder.
The output would be as below
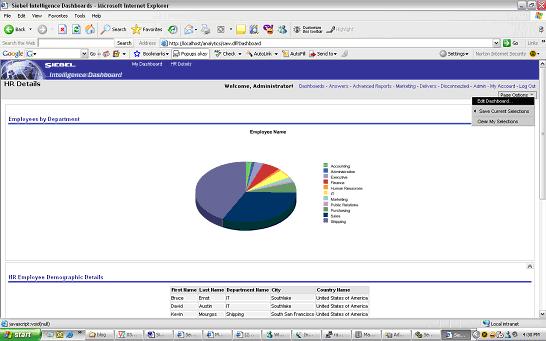 The layout can be changed by editing properties of sections in the Dashboard
Page Option > Edit Dashboard Click on the Properties Tab of sections if you want to edit the layout of sections.In the below view we have arranged the Reports Horizontally.
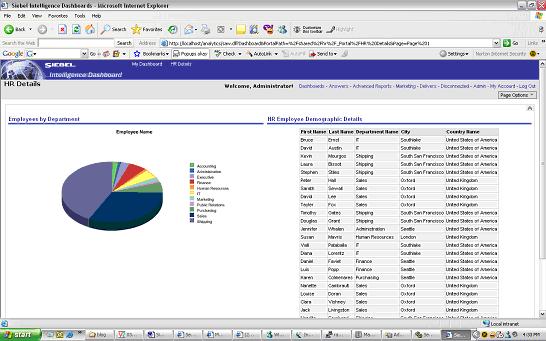 Example 4: Drill down from the Pie Chart to the Report Table in the HR Details Dashboard.
a)To Navigate from Dashboard to Answers easily include the modify link in the Dashboard.Page Options > Edit Dashboard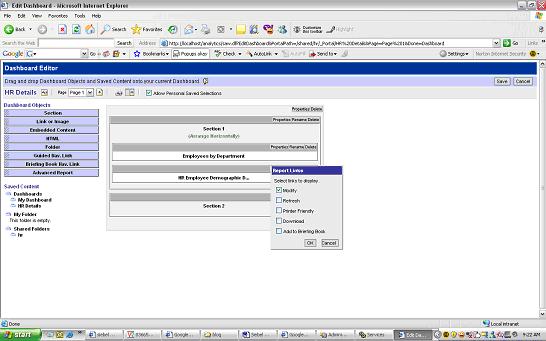 for each section select Properties > Report Links > Modify. Save and go back to Dashboard now you should see the modify links.
 b) To set the navigate link on the Pie Chart.Modify the pie chart > Results > edit view of the pie chart
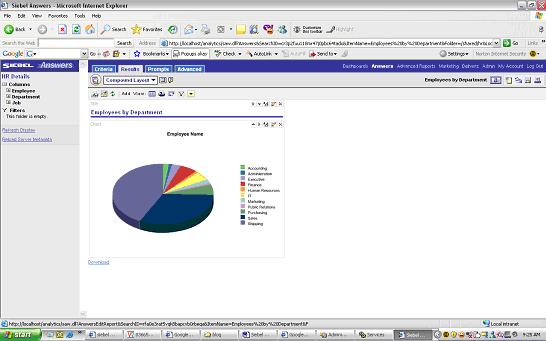

 select Additional Charting Options
Interaction Tab > select Navigate > and give the Navigation Page > “HR Details” Dashboard Page 1 c) Add an is prompted filter to the Table Report
from the dashboard click on Modify link of the Table. This will take you to criteria tab on Answers.Add a filter and set Department Name to “is prompted” and save the filter
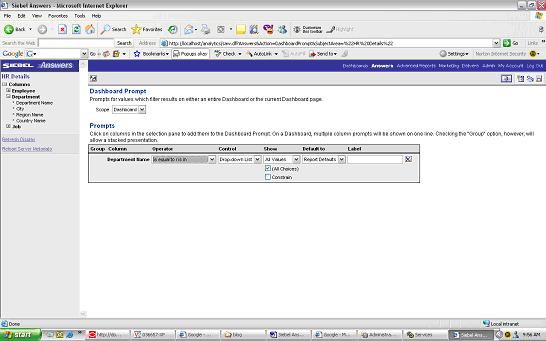
d) create a Dashboard Prompt click on Answers you should see an icon on the Left Menu to create a new Dashboard Prompt
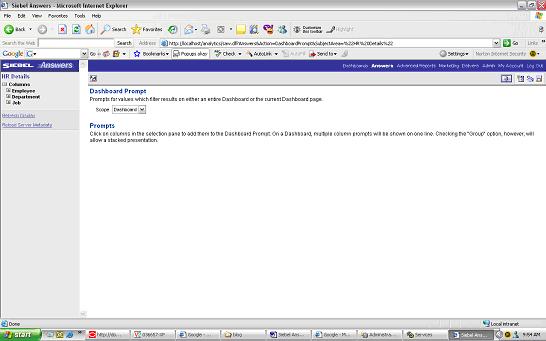 scope=Dashboardselect the column name on which you want to set the prompt to
save the Dashboard Prompt.
Now go to your Dashboard > Edit Page Options > Drop the Dashboard Prompt in the Section you would like to appear in and you should now see the Prompt on your Dashboard
you can drill down by Department Name from the Dashboard Prompt drop down.
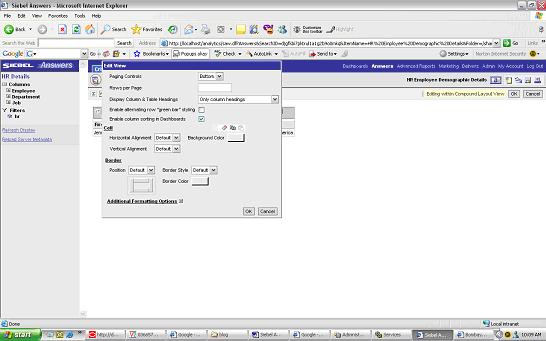
e) column sorting on Employee Demographic details
assume you also wanted the ability to sort by columns on the Table Report.Click on the Modify link on the Table Report > go to the Results Tab on Answers> Click on the edit view of the Table and then edit Table properties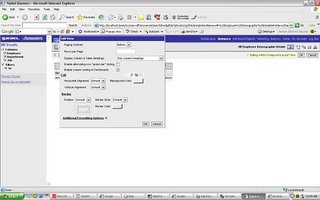
check “ enable column sorting on Dashboard”
At this point you have a fully functional Dashboard with Drill down ability both from the Dashboard prompt and from the pie chart to the Table.
The next posts will discuss:
1)XML Publisher and Answers/Dashboards
2)Admin Options with Answers(managing security, ibots etc)
posted by Vidya Balasubramanian at
9:31 AM
![]()
![]()

0 Comments:
Post a Comment
<< Home