
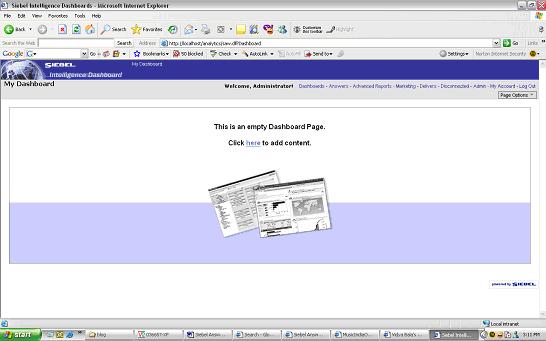
Informatica Step by Step to create a Simple Workflow Run successfully:
This post will cover a)How to create Repository User accounts and managing security in Informatica
b)Create a mapping , session, workflow and successfully execute a workflow
How to create Repository User accounts and managing security in Informatica
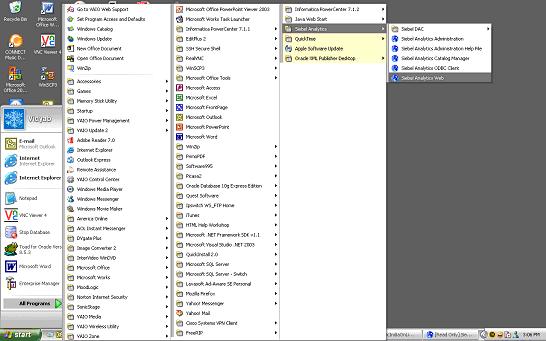
1) Login to Repository Server Admin console.Connect to the Repository Server
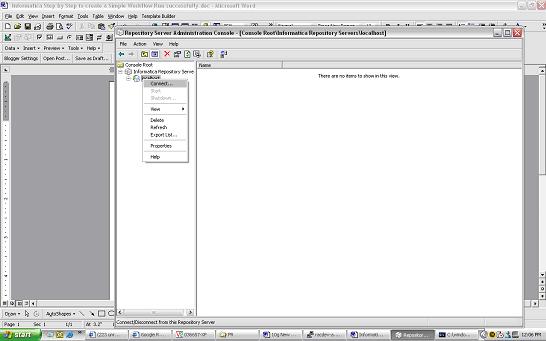 Right click and create new Repository
 4)give the following :
repository name
db connect string
db username : pcenter1
db password : pcenter1
license key information
when you click Apply the Repository content will get created.
5)Once the Repository is created loginto Repsoitory Manager
You can loginto the Repository either as
a) The Repository username/ password provided in the above step
b) Or Administrator
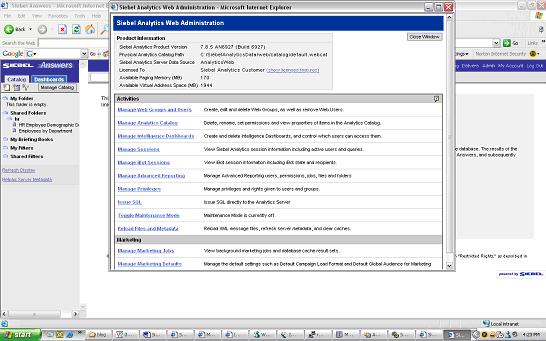
Go the Security > Manage Users and Privileges

By default 2 grps are created “Administrator” and “Public”
2 users are created “Administrator” and “Repository User”
Privileges tab lists all the privileges that are available. This security window can be used to manage Security and privileges – refer help guide for further information on security and privileges.
Create a mapping , session, workflow and successfully execute a workflow
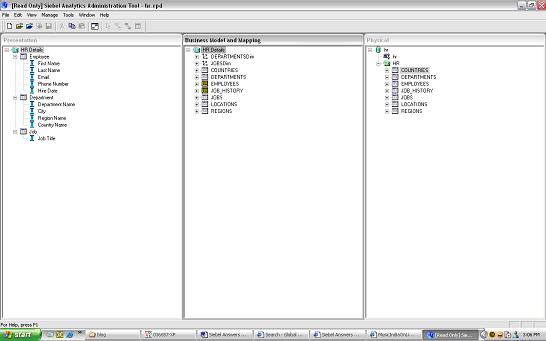
I will use the HR schema to demonstrate how you can create a mapping, session and workflow. The HR schema has the following tables
COUNTRIES
DEPARTMENTS
EMPLOYEES
JOBS
JOB_HISTORY
LOCATIONS
REGIONS
COUNTRY_REGION is table that has country_name and region_name.
To populate the country_region table : is a join between the country table and the region table
To create a mapping:
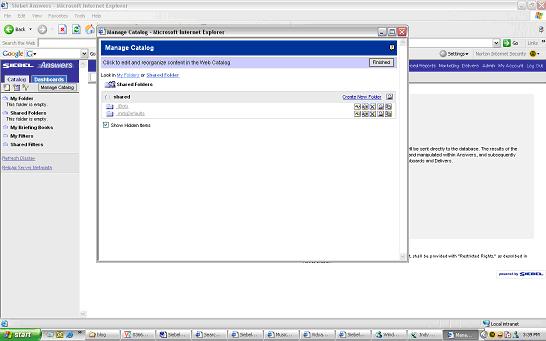
Open Repository Manager – Connect to the Repository and create new folder within the Repository using Repository Manager.
Connect to Designer
 Open the folder up and you should see Sources, Targets , Cubes , Dimensions etc.
From the Sources menu import from source Database objects you need: in this case you will import COUNTRIES and REGION Open Warehouse Designer and Import TargetsImport COUNTRY_REGION from Target Menu.
 Sources and Targets Menu should be as above
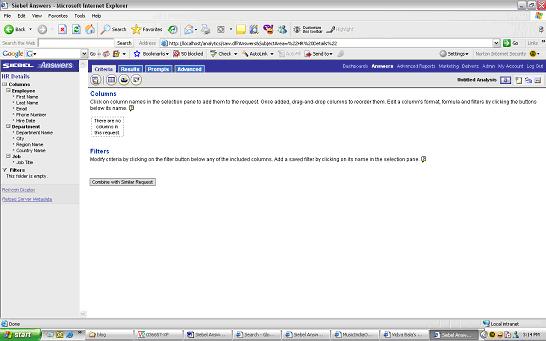
Open Mapping Designer.
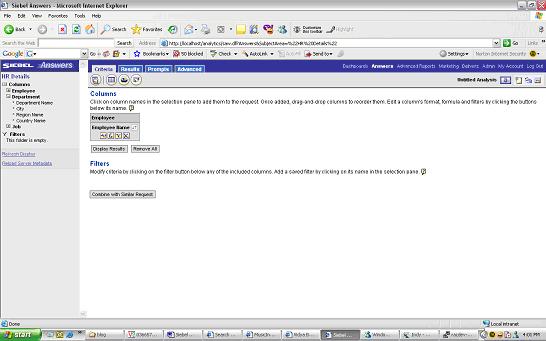
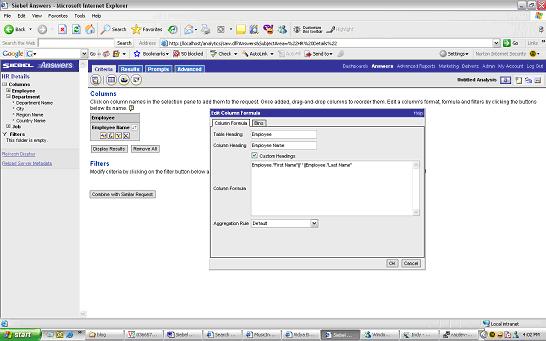
Drop in the sources to the Mapping Designer, Drop in the target as well to Mapping Designer.Include a Join Transform to join appropriately the COUNTRY and REGION table.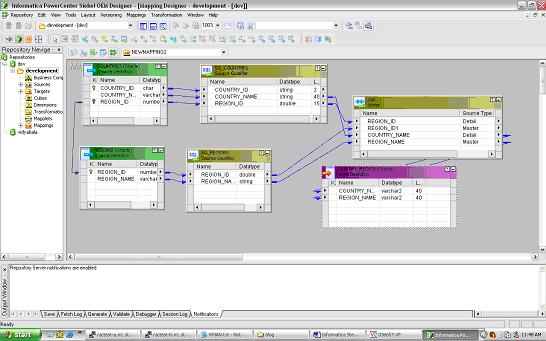 Name the mapping as COUNTRY_REGION_MAPPING. While saving the mapping make sure parsing completed with no errors. Errors will be reported on the Output window of the Designer.
Once you have saved the Mapping you can now open up your Workflow Manager to create a session and a workflow.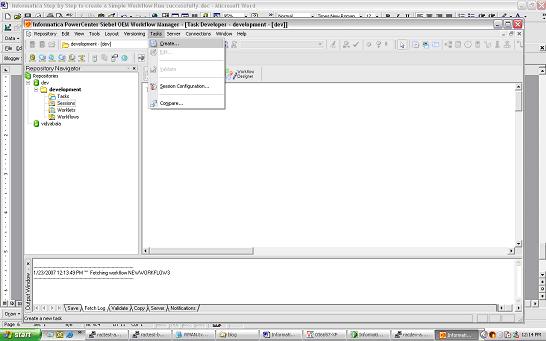 Tasks - Create - creates a new Session or Task
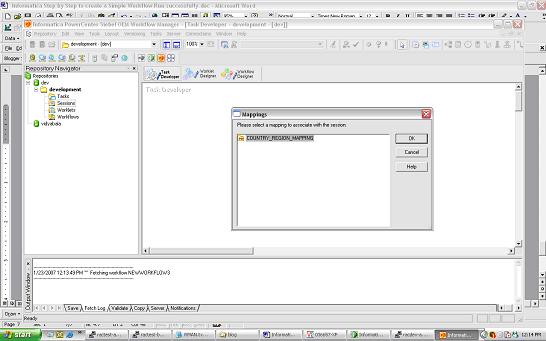 select the COUNTRY_REGION mapping and save the Repository.
Click on Connections/Relational to create 2 new connections for your Source and Target databases.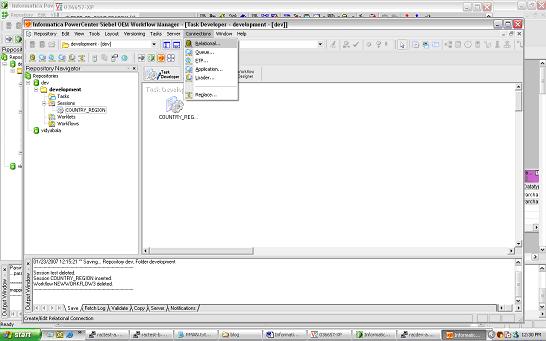 once the connections are created Click on the Task and you should see the following properties window open up
 click on the Mappings Tab and verify the connections are set appropriately.
When you are ready to create the Workflow – Open Workflow Designer and drag and drop the mapping. Name the Workflow as COUNTRY_REGION_WORKFLOW
Save Repository and in the Output window verify that the workflow is valid.
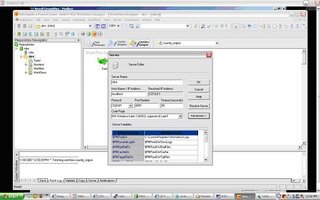
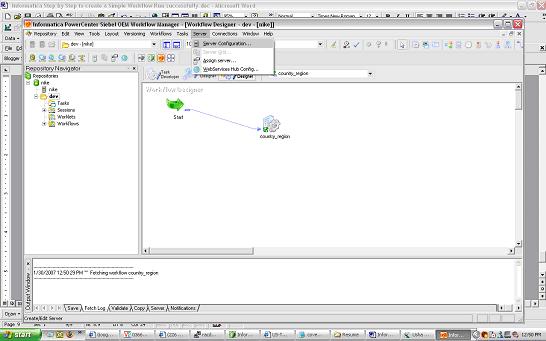
Before you start running the workflow make sure to register the Power Center Server
Open Workflow Manager – Server – Server Registration give all the Power Center Server Registration Properties and define your PMRootDir
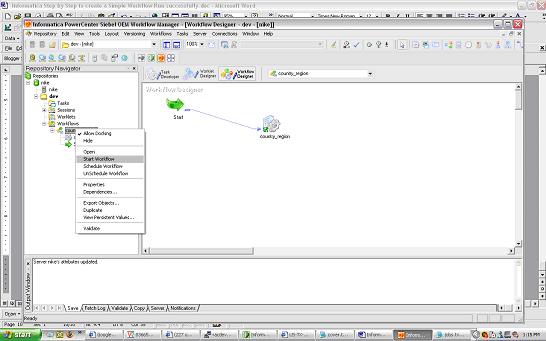
Click OK and , Right Click Server and assign the workflow you want to run using the Server. Once you have assigned the workflow to the server you can start the workflow – right click the workflow and click start
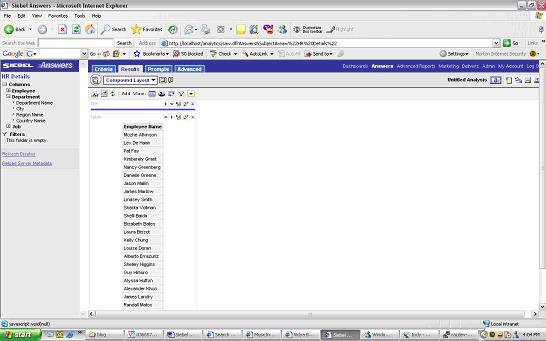
 workflow monitor should start indicating the status of the run
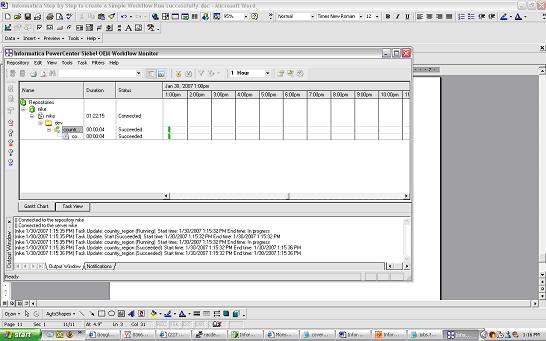 Right click the workflow and task and you should be able to view the workflow log and session log. From workflow Manager workflows can also be scheduled.
If you run into any issues running a workflow – feel free to post comments. The next 2 posts will cover a) versioning b)debugging using informatica.
posted by Vidya Balasubramanian at
11:38 AM
|
4 comments
![]()
![]()


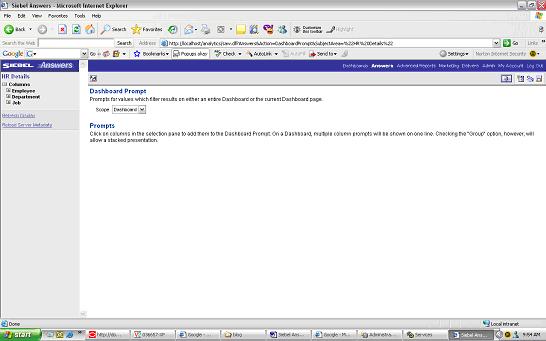
 XML Publisher Enterprise Edition
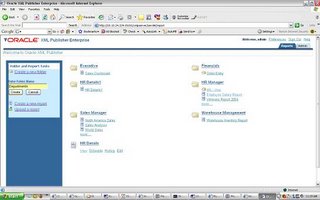
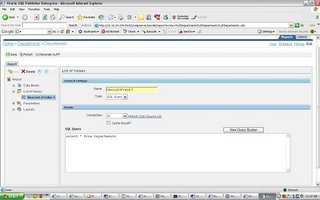 iv)Parameters: if any parameters are needed for the Report


