No Monitoring Tools to Monitor your Database?
Have you been part of an organization that has huge Oracle Databases but no database monitoring tools? It seems to be quite normal – while funding for database Licenses have been approved without a problem it has been quite a challenge to get funding approved for monitoring tools like SpotLight, Foglight, Precise, Hotsos Profiler etc.
So how does a DBA then debug performance issues? While writing shell scripts to monitor space usage, memory usage to page the DBA will help – scripts may not be the best way to solve the performance problem in hand when users are complaining about slow performance.
I have worked for organization where we had no third party Products to monitor our databases or drill down into Performance Issues when users are complaining about slow performance. This is where OEM Diagnostic Pack (Performance Manager) has come very handy.
Some of the key things to look for in Performance Manager – that has helped me solve numerous performance issues are below
-Look for Top Waits for Time waited.
-Take a look into the Top Session by CPU/Memory and I/O
-see any one of those sessions could be attributing to the Top wait event
Eg:
If db sequential read is one of your top wait events
Look at yout Top I/O SQL statements - most likely one of them is attributing to your db sequential read wait event
Verify the explain plan of the sql and tune your sql
You will be amazed how tuning the sql will make the wait event dissappear and all the sql statements waiting on the event dissapear
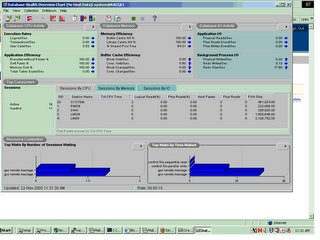
Screenshots below will show you how to look at these using the Diagnostic Pack.

Look at your top waited events above.
Look for your top sessions by I/O,Memory and CPU - look at the sql and analyze how they attribute to your top wait event.
View session details will give you all the detail information you need about the sessions.
Performance Monitoring is a vast subject - what was listed above is just a quick way your DBA can dive into the database and see what exactly is happening. While statspack is great for metrics collections - most likely is not the best tool you have in hand when you have users standing behind you wanting you to solve their performance problem asap.
I strongly recommend using the Diagnostic Pack if your organization has no other monitoring tools inhouse - as you get familiar with the product you will decide its time to put your scripts away to solve performance issues.
Have you been part of an organization that has huge Oracle Databases but no database monitoring tools? It seems to be quite normal – while funding for database Licenses have been approved without a problem it has been quite a challenge to get funding approved for monitoring tools like SpotLight, Foglight, Precise, Hotsos Profiler etc.
So how does a DBA then debug performance issues? While writing shell scripts to monitor space usage, memory usage to page the DBA will help – scripts may not be the best way to solve the performance problem in hand when users are complaining about slow performance.
I have worked for organization where we had no third party Products to monitor our databases or drill down into Performance Issues when users are complaining about slow performance. This is where OEM Diagnostic Pack (Performance Manager) has come very handy.
Some of the key things to look for in Performance Manager – that has helped me solve numerous performance issues are below
-Look for Top Waits for Time waited.
-Take a look into the Top Session by CPU/Memory and I/O
-see any one of those sessions could be attributing to the Top wait event
Eg:
If db sequential read is one of your top wait events
Look at yout Top I/O SQL statements - most likely one of them is attributing to your db sequential read wait event
Verify the explain plan of the sql and tune your sql
You will be amazed how tuning the sql will make the wait event dissappear and all the sql statements waiting on the event dissapear
Screenshots below will show you how to look at these using the Diagnostic Pack.

Look at your top waited events above.
Look for your top sessions by I/O,Memory and CPU - look at the sql and analyze how they attribute to your top wait event.
View session details will give you all the detail information you need about the sessions.
Performance Monitoring is a vast subject - what was listed above is just a quick way your DBA can dive into the database and see what exactly is happening. While statspack is great for metrics collections - most likely is not the best tool you have in hand when you have users standing behind you wanting you to solve their performance problem asap.
I strongly recommend using the Diagnostic Pack if your organization has no other monitoring tools inhouse - as you get familiar with the product you will decide its time to put your scripts away to solve performance issues.

1 Comments:
also, i find InfoCaptor very handy, allows you to store various queries and define drills from one window to another, you can create a customzied dashboard. this is available at http://www.infocaptor.com
By Nilesh Jethwa, at 4:05 PM
Post a Comment
<< Home